Inox Wind |2QFY2019 Result Update
November 10, 2018
INOX Wind Ltd.
BUY
CMP
`90
Target Price
`120
Quarterly (` cr)
Q2FY19
Q2FY18
% yoy Q1FY19
% qoq
Investment Period
12 Months
Net sales
437
80
449%
430
1%
EBITDA
53
-20
NA
70
-25%
Stock Info
Sector
Capital Goods-Wind
EBITDA margin (%)
12.1%
-25.4%
NA
16.4%
-422
Market Cap (` cr)
1,997
Adjusted PAT
1.52
-70.60
NA
10.44
-85%
Beta
1.3
52 Week High / Low
158/73
During the quarter under review, Inox Wind Ltd. (IWL) has reported flattish growth in revenue
Avg. Daily Volume
25,125
on qoq basis at INR 437 cr from INR 430 cr. However, EBIDTA/ PAT (INR 53 cr., (-25%
Face Value (`)
10
BSE Sensex
35,158
qoq)/INR 1.52cr (-85% qoq)) declined drastically. EBIDTA margin fell by 422bps to 12.13%
Nifty
10,585
Reuters Code
INWN.BO
from 16.35% during the same period on account of forex loss of INR 5 cr as against forex
Bloomberg Code
INXW IN
gain of INR 2 cr in previous quarter and increases in other expenses such as payment of royalty
against purchase of turbines and job handling charges.
Shareholding Pattern (%)
Promoters
75.0
o IWL has delivered 170MW of wind turbines during H1FY2019 and left with an order
MF / Banks / Indian Fls
0.8
book of 780MW, which is executable by FY2020-21. During the quarter, it has
FII / NRIs / OCBs
7.6
delivered 90MW as against 80MW in Q1FY19. Further, IWL is in the advanced stage
Indian Public / Others
16.6
to conclude 600MW order from various IPPs.
o Key things to watch out for in the near term are (a) execution pick up, (b) meaningful
Abs.(%)
3m
1yr
3yr
reduction in debt level and (C) order inflow. However, by looking at the government’s
Sensex
0.03
12.6
25.3
ambitious target to auction 10GW of wind capacity every year till FY2028 our outlook
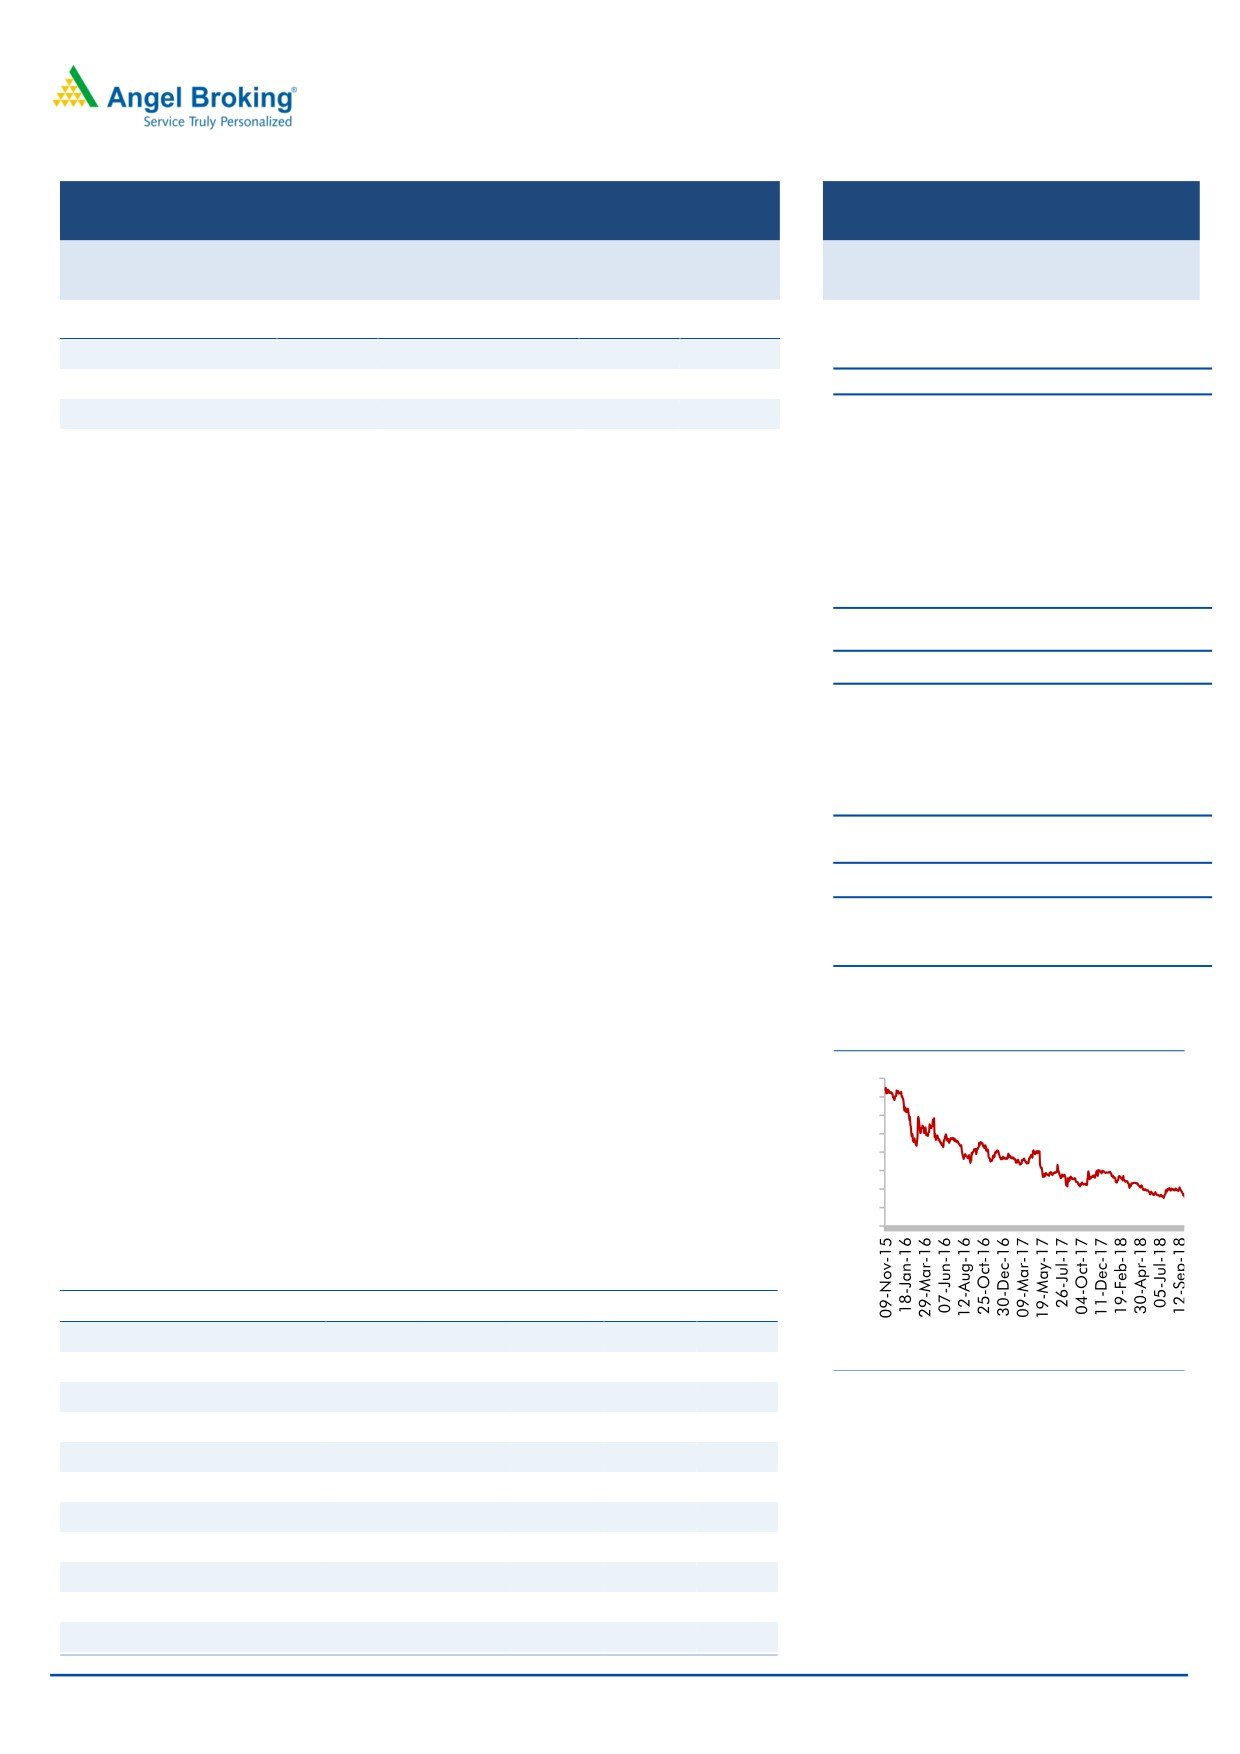
INOX Wind
(8.7)
(32.9)
(75.9)
for sector looks promising in long term.
3 Years Performance charts
Outlook and Valuation: Considering the changing dynamics of renewable energy
consumption and government’s thrust to auction 10 GW wind capacity every year by
400
350
2028, we are bullish on sector and hence have a positive outlook on IWL. At the CMP of
300
250
INR 90, stock is available at PE multiple of 5.8x its FY2020E EPS of INR 16. We
200
150
recommend a BUY on Inox Wind and assign a multiple of 7.5x to arrive at a target price
100
of INR 120 implying a potential upside of 33%.
50
0
Key Financial
Y/E March (` cr)
FY16
FY17
FY18
FY19E FY20E
Net Sales
4,451
3,415
480
3,005
4,036
% chg
65
(23)
(86)
526
34
Source: Capitaline Angel Research
Net Profit
461
303
-188
228
355
% chg
(30)
(34)
(162)
(221)
56
EBITDA (%)
16.0%
16.4%
-17.0%
15.0%
15.0%
EPS (Rs)
21
14
-8
10
16
P/E (x)
4
7
-11
9
5.6
P/BV (x)
1.1
0.9
1.0
0.9
0.8
Kripashankar Maurya
RoE (%)
24.4
13.9
(9.4)
10.2
13.7
022 39357600, Extn: 6004
RoCE (%)
20.4
13.9
(4.7)
12.9
16.0
EV/EBITDA
3.8
5.0
(28.6)
5.0
3.6
November 10, 2018
1
Inox Wind |2QFY2019 Result Update
Exhibit 1: Q2FY19 Performance
In INR Cr
Q2FY19
Q2FY18
Q1FY19
YOY % QOQ%
Net Sales
437
80
430
449%
1%
Total Income
437
80
430
449%
1%
Total Expenditure
384
100
360
285%
7%
Raw Material Consumed
265
4
251
5874%
6%
Stock Adjustment
-4
20
2
NA NA
Purchase of Finished Goods
0
0
0
NA NA
COGS
261
24
253
970%
3%
(Profit)/ Loss on Forex Transaction
5
2
-2
Employee Expenses
24
26
22
-8%
7%
EPC,O&M, and common Infra Facility expenses
27
29
38
-5%
-27%
Other Expenses
66
18
50
269%
33%
As a % of sales
Raw Material Consumed
61%
6%
58%
Stock Adjustment
-1%
25%
0%
Purchase of Finished Goods
0%
0%
0%
COGS
98%
550%
101%
Gross Margin %
40%
69%
41%
(Profit)/ Loss on Forex Transaction
1%
3%
-1%
0%
0%
Employee Expenses
9%
585%
9%
Other Expenses
25%
405%
20%
EBITDA
53
-20
70
NA
-25%
Other Income
5.29
7.6
3.3
-31%
61%
Interest
39.34
44.5
39.1
-12%
1%
PBDT
18.93
-57.08
34.55
NA
-45%
Depreciation
16.49
14
16
22%
1%
PBT
2.44
-70.60
18.19
NA
-87%
Tax
0.92
-
8
NA
-88%
PAT
1.52
-71
10
NA
-85%
Ratios
BPS
BPS
EBITDA margin (%)
12.13% -25.44%
16.35%
NA -422.20
PAT margin %
0.35%
-88.79%
2.43%
NA
-208
Tax rate %
37.70%
NA
42.61%
NA
-490
Source: Company, Angel Research
Q2FY2019 Key highlights of results
During the quarter under review, Inox Wind Ltd. (IWL) has reported flattish
growth in revenue on qoq basis at INR 437 cr from INR 430 cr. However,
EBIDTA/ PAT (INR 53 cr., -25% qoq/ INR 1.52 cr (-85%) (qoq) declined
drastically;
EBIDTA margin fell by 422bps points to 12.13% from 16.35% on account of
forex loss of INR 5 cr as against forex gain of INR 2 cr in previous quarter and
increases in other expenses such as payment of royalty against purchase of
turbines and job handling charges;
IWL had to take the hit of foreign exchange fluctuation as most of the execution
for the company is happening from SECI-I and SECI-II, where there is no pass
November 10, 2018
2
Inox Wind |2QFY2019 Result Update
on benefit available. Currently, IWL import raw material roughly 30-35% of
revenue in three foreign currencies namely USD, EURO and YUAN; however,
the management is looking to change the import mix to a favourable currency.
We believe this move will help to improve IWL’s margins going forward;
IWL has delivered 170MW of wind turbines during H1FY2019 and left with an
order book of 780MW, which is executable by FY2020-21. During the quarter,
it has delivered 90MW as against 80MW in Q1FY19. IWL is in the advanced
stage to conclude 600MW order from various IPPs.
Outlook & Valuation
Considering the changing dynamics of renewable energy consumption and
government’s thrust to auction 10 GW wind every year capacity by 2028, we are bullish
on sector and hence have a positive outlook on IWL. At the CMP of INR 90, stock is
available at PE multiple of 5.8x its FY2020E EPS of INR 15.6. We recommend a Buy on
Inox Wind and assign a multiple of 7.5x to arrive at a target price of INR 120 implying a
potential upside of 33%.
Risks to our estimates
Delay in auction
Any delay in auction of wind energy may leads to slowdown in sector hence create an
uncertainty in revenue visibility.
November 10, 2018
3
Inox Wind |2QFY2019 Result Update
Income statement
Y/E March (` cr)
FY16
FY17
FY18
FY19E
FY20E
Total operating income
4,451
3,415
480
3,005
4,036
% chg
65
(23)
(86)
526
34
Total Expenditure
3,737
2,855
561
2,555
3,430
Raw Material
2,716
1,920
47
1,863
2,502
Personnel
92
117
100
60
81
Loss on Forex Transaction
21
-19
-1
-
-
Others Expenses
908
836
416
631
847
EBITDA
713
560
-81
451
605
% chg
(22)
(21)
(115)
(654)
34
(% of Net Sales)
16.0%
16.4%
-17.0%
15.0%
15.0%
Depreciation& Amortisation
36
44
52
55
59
EBIT
677
517
-134
396
546
% chg
(25)
(24)
(126)
(397)
38
(% of Net Sales)
15
15
-28
13
14
Interest & other Charges
98
155
171
115
95
Other Income
70
65
24
27
29
Extraordinary Items
-
-
-
Recurring PBT
649
427
-280
308
480
% chg
(24)
(34)
(166)
(210)
56
Tax
188
124
-93
80
125
PAT (reported)
461
303
-188
228
355
% chg
(46)
(34)
(162)
(221)
56
(% of Net Sales)
10.4
8.9
-39.1
7.6
8.8
Basic & Fully Diluted EPS (Rs)
21
14
-8
10
16
% chg
(97)
(34)
(162)
(221)
56
Source: Company, Angel Research
November 10, 2018
4
Inox Wind |2QFY2019 Result Update
Balance Sheet
Y/E March (`cr)
FY16
FY17
FY18
FY19E
FY20E
SOURCES OF FUNDS
Equity Share Capital
221.9
221.9
221.9
221.9
221.9
Reserves& Surplus
1,665
1,968
1,782
2,010
2,366
Shareholders Funds
1,887
2,190
2,004
2,232
2,588
Total Loans
1,437
1,528
831
831
831
Other Liabilities
50
113
33
355
355
Total Liabilities
3374
3831
2868
3418
3773
APPLICATION OF FUNDS
Net Block
569
765
985
1,062
1,098
Capital Work-in-Progress
43
112
20
20
20
Investments
-
53
0
-
-
Long Term Loans & Advances
12
16
15
21
21
Current Assets
3,895
3,938
2,708
3,275
4,012
Inventories
560
690
929
618
829
Sundry Debtors
2,409
2,382
1,339
2,059
2,432
Cash
494
437
127
368
466
Loans & Advances
304
87
0
0
0
Investments & Others
128
341
313
231
284
Current liabilities
1,404
1,324
1,230
1,163
1,579
Net Current Assets
2,491
2,614
1,478
2,112
2,432
Other Non Current Asset
260
270
370
203
202
Total Assets
3374
3831
2868
3418
3773
Source: Company, Angel Research
Cash flow
Y/E March (`cr)
FY16
FY17
FY18
FY19E
FY20E
Profit before tax
649
427
(280)
308
480
Depreciation
36
44
52
55
59
Change in Working Capital
283
(436)
(669)
316
237
Interest / Dividend (Net)
98
155
171
115
95
Direct taxes paid
188
124
(93)
80
125
Others
(1,418)
(200)
1,088
(351)
(553)
Cash Flow from Operations
(163)
114
269
522
443
(Inc.)/ Dec. in Fixed Assets
(404)
(290)
(186)
(272)
(99)
(Inc.)/ Dec. in Investments
(31)
(111)
302
0
-
Cash Flow from Investing
(968)
(5)
332
(272)
(99)
Issue of Equity
-
-
-
-
-
Inc./(Dec.) in loans
1,403
90
-697
-
-
Others
(901)
(71)
(63)
72
(245)
Cash Flow from Financing
501
19
(760)
72
(245)
Inc./(Dec.) in Cash
(630)
128
(159)
322
98
Opening Cash balances
706
76
204
46
368
Closing Cash balances
76
204
46
368
466
Source: Company, Angel Research
November 10, 2018
5
Inox Wind |2QFY2019 Result Update
Key Ratio
Y/E March
FY16
FY17
FY18
FY19E FY20E
P/E (on FDEPS)
4
7
-11
8.8
5.6
P/CEPS
4
6
-15
7.1
4.8
P/BV
1
1
1
0.9
0.8
EV/Sales
1
1
5
0.8
0.5
EV/EBITDA
4
5
-29
5.0
3.6
EV / Total Assets
6
5
4
4.0
3.8
Per Share Data (Rs)
EPS (Basic)
21
14
-8
10.3
16.0
EPS (fully diluted)
21
14
-8
10.3
16.0
Cash EPS
22
16
-6
12.7
18.7
DPS
0
0
0
0.0
0.0
Book Value
85
99
90
100.6
116.6
Returns (%)
ROCE
20
14
-5
12.9
16.0
Angel ROIC (Pre-tax)
24
16
-5
13.1
16.6
ROE
24
14
-9
10.2
13.7
Turnover ratios (x)
Inventory / Sales (days)
46
74
707
75
75
Receivables (days)
198
255
1018
250
220
Payables (days)
97
104
408
110
110
Working capital cycle (ex-cash) (days)
146
225
1317
215
185
Source: Company, Angel Research
November 10, 2018
6
Inox Wind |2QFY2019 Result Update
Research Team Tel: 022 - 39357800
DISCLAIMER:
Angel Broking Limited (hereinafter referred to as “Angel”) is a registered Member of National Stock Exchange of India Limited, Bombay Stock
Exchange Limited, Metropolitan Stock Exchange Limited, Multi Commodity Exchange of India Ltd and National Commodity & Derivatives Exchange
Ltd It is also registered as a Depository Participant with CDSL and Portfolio Manager and Investment Adviser with SEBI. It also has registration
with AMFI as a Mutual Fund Distributor. Angel Broking Limited is a registered entity with SEBI for Research Analyst in terms of SEBI (Research
Analyst) Regulations, 2014 vide registration number INH000000164. Angel or its associates has not been debarred/ suspended by SEBI or any
other regulatory authority for accessing /dealing in securities Market. Angel or its associates/analyst has not received any compensation /
managed or co-managed public offering of securities of the company covered by Analyst during the past twelve months.
This document is solely for the personal information of the recipient, and must not be singularly used as the basis of any investment decision.
Nothing in this document should be construed as investment or financial advice. Each recipient of this document should make such investigations
as they deem necessary to arrive at an independent evaluation of an investment in the securities of the companies referred to in this document
(including the merits and risks involved), and should consult their own advisors to determine the merits and risks of such an investment.
Reports based on technical and derivative analysis center on studying charts of a stock's price movement, outstanding positions and trading
volume, as opposed to focusing on a company's fundamentals and, as such, may not match with a report on a company's fundamentals. Investors
are advised to refer the Fundamental and Technical Research Reports available on our website to evaluate the contrary view, if any
The information in this document has been printed on the basis of publicly available information, internal data and other reliable sources believed
to be true, but we do not represent that it is accurate or complete and it should not be relied on as such, as this document is for general guidance
only. Angel Broking Limited or any of its affiliates/ group companies shall not be in any way responsible for any loss or damage that may arise
to any person from any inadvertent error in the information contained in this report. Angel Broking Limited has not independently verified all the
information contained within this document. Accordingly, we cannot testify, nor make any representation or warranty, express or implied, to the
accuracy, contents or data contained within this document. While Angel Broking Limited endeavors to update on a reasonable basis the
information discussed in this material, there may be regulatory, compliance, or other reasons that prevent us from doing so.
This document is being supplied to you solely for your information, and its contents, information or data may not be reproduced, redistributed or
passed on, directly or indirectly.
Neither Angel Broking Limited, nor its directors, employees or affiliates shall be liable for any loss or damage that may arise from or in connection
with the use of this information.
Disclosure of Interest Statement
Company Name
1. Financial interest of research analyst or Angel or his Associate or his relative
No
2. Ownership of 1% or more of the stock by research analyst or Angel or associates or relatives
No
3. Served as an officer, director or employee of the company covered under Research
No
4. Broking relationship with company covered under Research
No
November 10, 2018
7